Data Science with Raghav

Everything related to Data and AI

Skip to content
Menu
  • Home
  • Data Science
  • Data Engineering
  • AI
  • NLP
  • Productivity
  • General
  • About
  • Contact
  • Privacy Policy

Tag: Wheat production data visualization in python

Visualizing Wheat Production, Supply and Usage data using Python Seaborn library: Visualization basics in Python
Data Science

Visualizing Wheat Production, Supply and Usage data using Python Seaborn library: Visualization basics in Python

Posted on December 25, 2022December 25, 2022 by Raghav

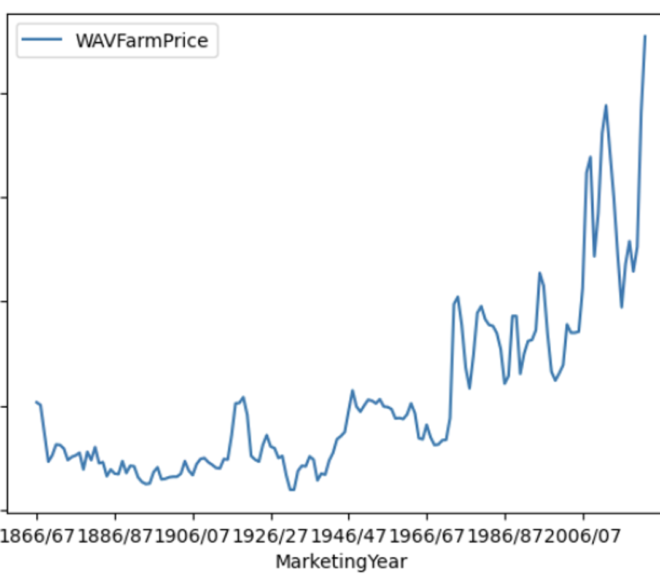
In this article we will learn how to visualize a dataset using Python Seaborn library, specifically focussing on the Wheat Production and Supply dataset released…

© Copyright 2025 – Data Science with Raghav
Wisteria Theme by WPFriendship ⋅ Powered by WordPress
We use cookies to ensure that we give you the best experience on our website. If you continue to use this site we will assume that you are happy with it.OkNoPrivacy policy